Set the Right Foundation
.png?width=2000&height=912&name=Determine%20Desired%20Outcomes_0%20(1).png)
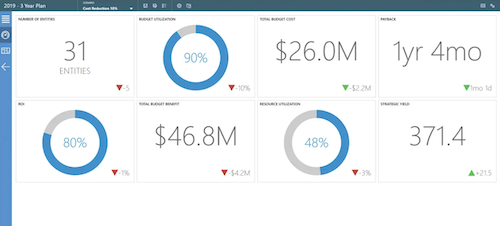
Quickly and easily determine what you want to achieve, whether it’s reducing technical debt, modernizing applications, preparing for Information governance, migrating to the Cloud, consolidating data centers, and more. Consider:
- Combination of outcomes and assigned weights
- How much of each measure must be achieved
- Determine survey questions based on patterns uncovered

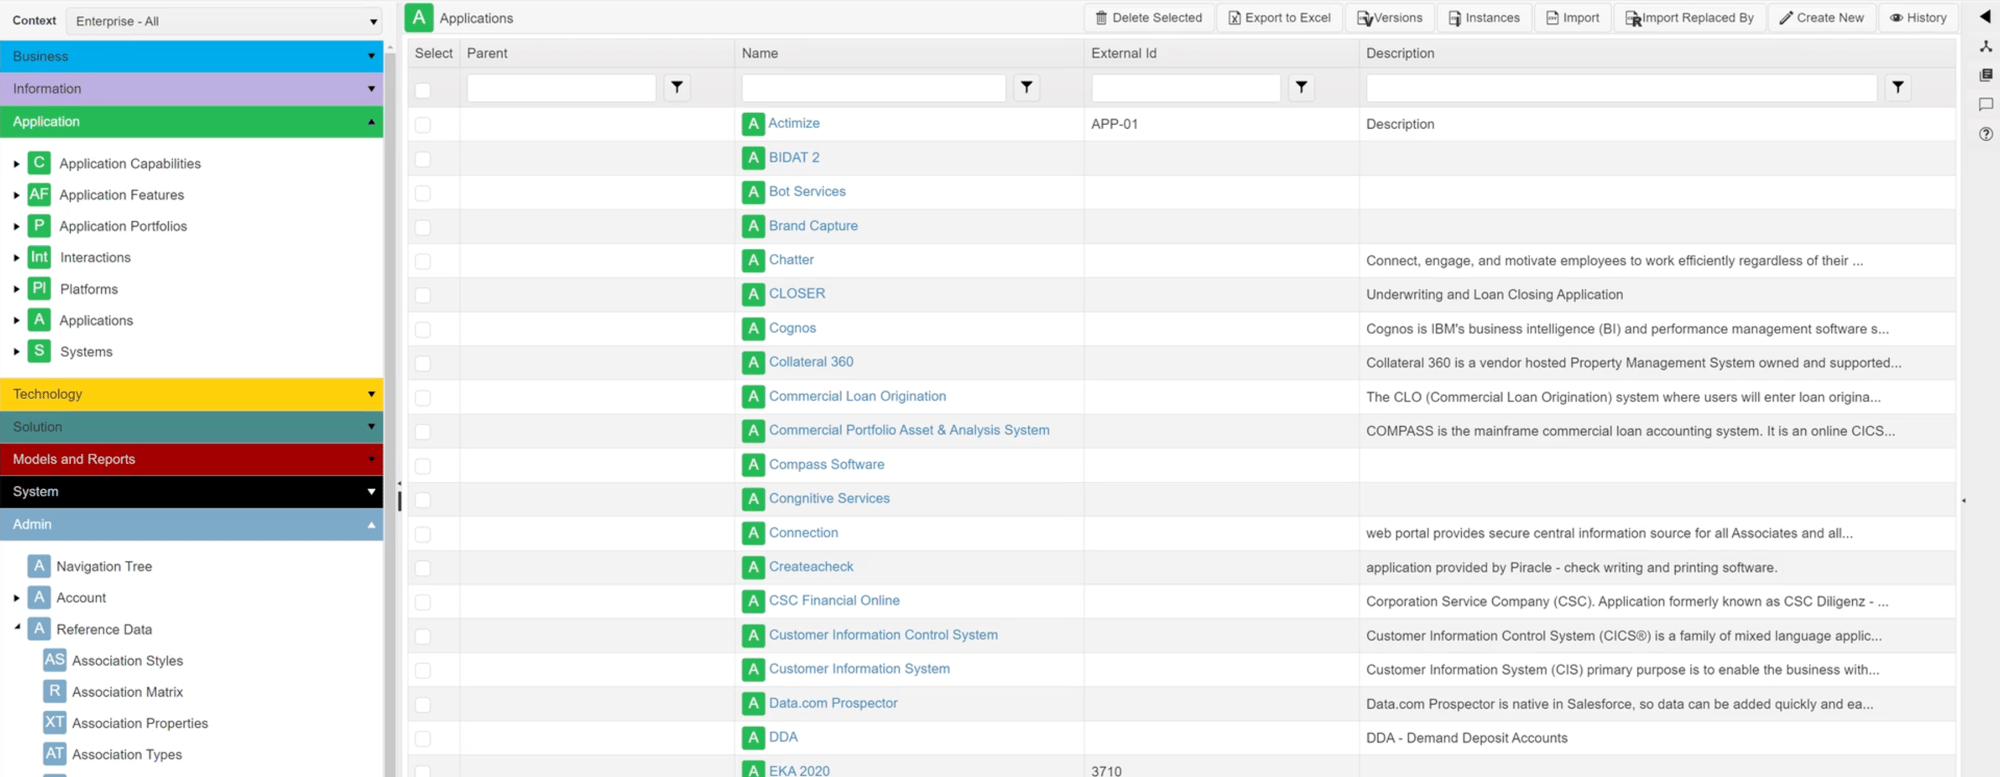
Consolidate and streamline the standardized capture of inventories across various dimensions with ease, including:
- Existing Repositories
- Configuration Management Databases
- Spreadsheets
- Finance Catalogs
They can all be easily imported into NH360 Enterprise Connect, and then cross-referenced and validated.

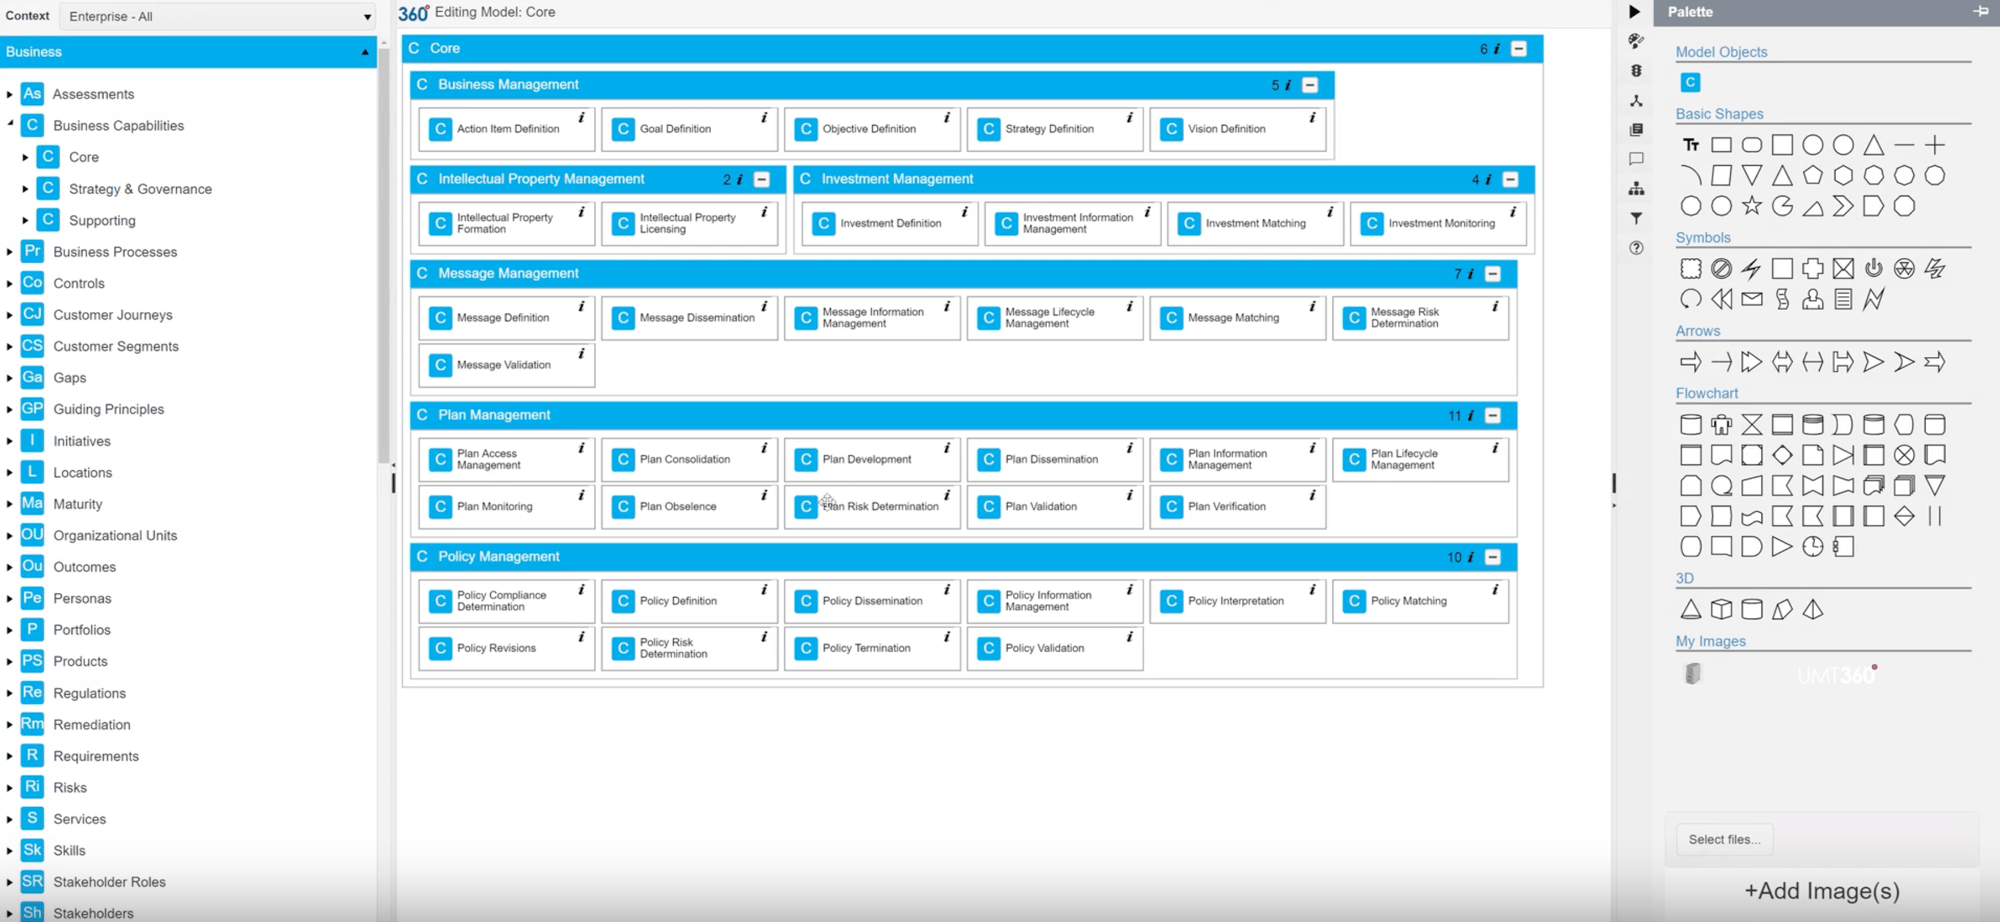
Build a foundation to rationalize data quickly and provide visual anchors for relevant viewpoints, including:
- Business Capability (“what” the business does)
- Value Streams and Processes (“how” the business works and can be improved)
- Information Landscapes (“the Stuff” of the Business, what is important)
- Organizational Landscapes (“who” is involved, and how value flows across the organization)
- Technology Reference Models (the supporting technologies that are the foundation for your IT Department)

Build fully-integrated surveys, distribute them, collect results, resolve conflicts, and capture the findings.
- Quickly and easily build surveys to collect the information you need
- Distribute the surveys to stakeholders, including partners and suppliers
- Collect the results, resolve conflicts, and capture the findings in the Insight Repository
- Gather Application intake through easy-to-use forms
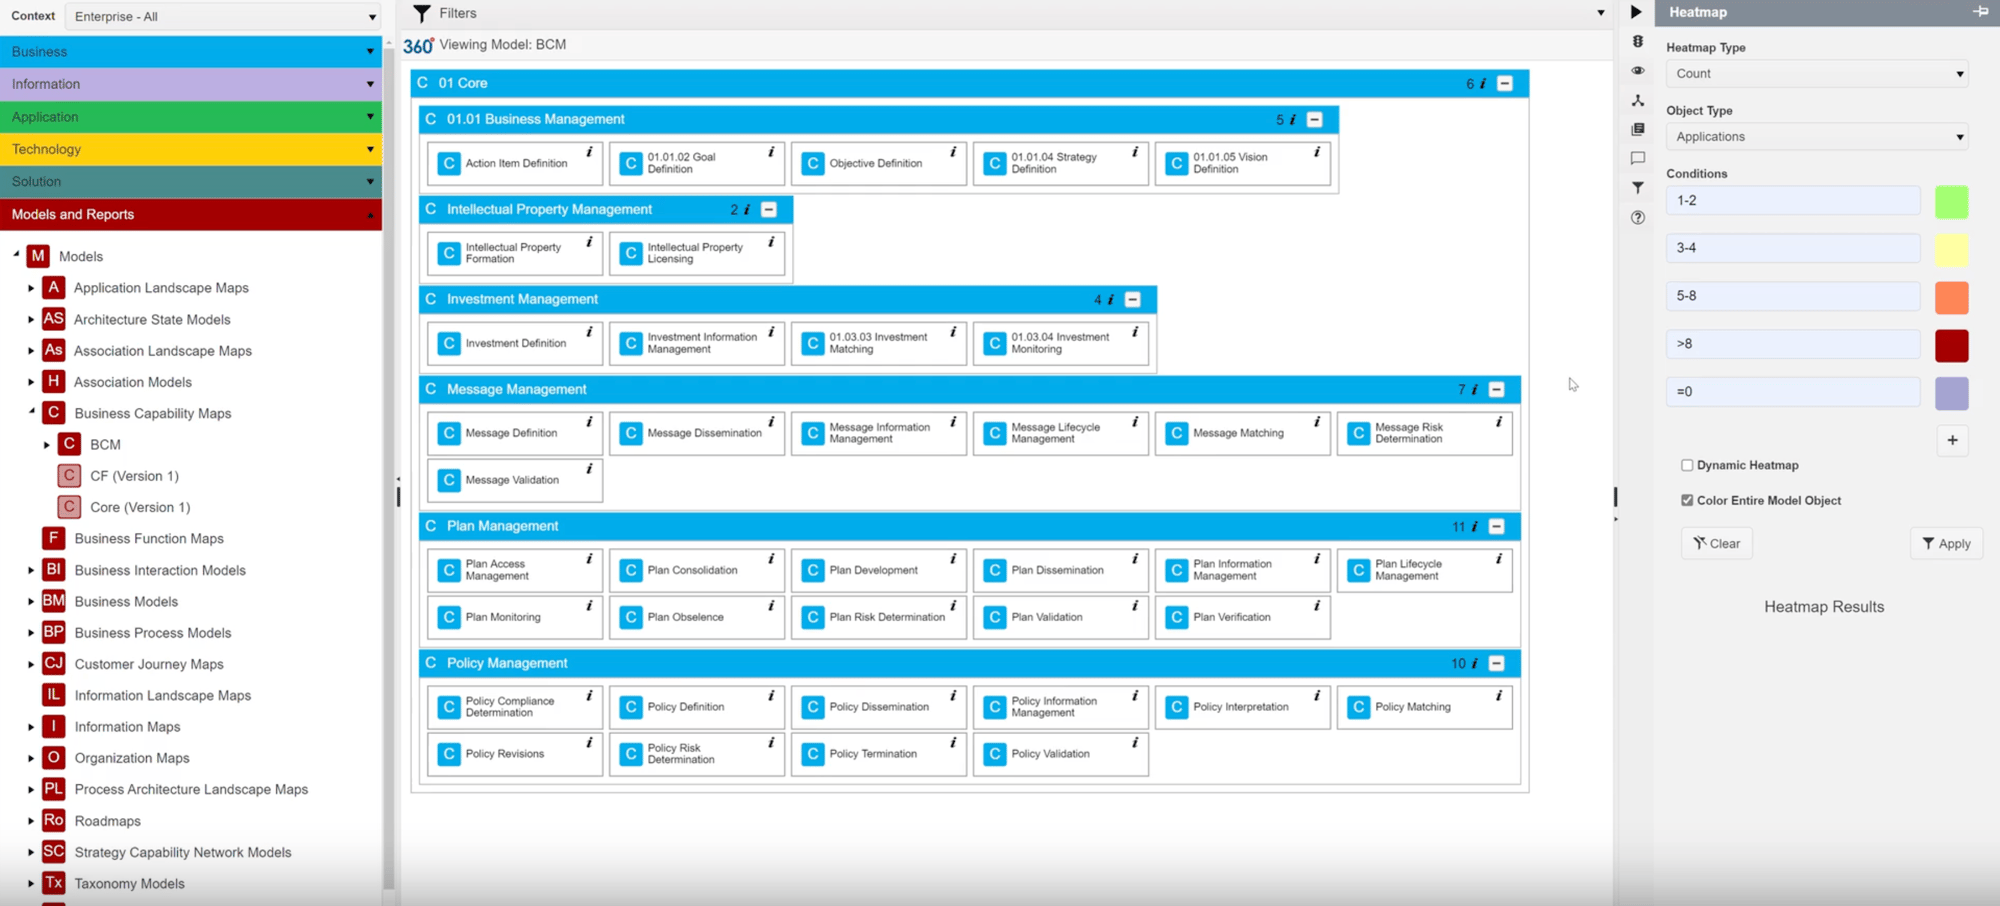
Analyze the results across various dimensions, including Sentiment Analysis, Heat Maps, Application Value Charts, and more.
- Sentiment Analysis shows the types of responses and questions needing refinement for additional coverage
- Heat Maps can be automatically generated using base models such as Business Capabilities, Information Landscapes, Value Streams, Organizational Views and Technical Reference Models
- Application Value Charts (“TIME Charts”) show the relative disposition of the Applications in one or many Portfolios
- The Criteria for all these Charts and Models can be adjusted on-the-fly to support rich analysis and to compare scenarios to support discovery of Functional Redundancy, Strategic Fit, and Application Business and Technical Health

Add the Capabilities You Need, Quickly
Every accelerator is crafted for quick implementation with minimal configuration required. They draw from years of successful client engagements and best practices, ensuring you get the capabilities you need without the hassle.


