




Why Dashboards Are Green but Your Business Outcomes Are Flat
Velocity feels good. Sprints close on schedule, the charts trend upward, and progress looks undeniable. Yet the results still don’t soar.
Here's the common anti-pattern we often see: teams hit their velocity targets week after week, customer outcomes don't move, business results lag, and leadership can't explain why things feel slow despite the progress reports.
Why Velocity Became Popular, and Where it Broke
Teams use velocity to measure how much work gets done in a given amount of time (often a single sprint), typically seen in the form of story points. It earned its place, and the pattern usually starts innocently. Leadership wants an easy way to see if delivery is improving and pulls velocity into their portfolio dashboard. Soon the questions start: why are teams’ points down, why is one team faster than the other, how quickly can next quarter’s roadmap be forecasted after only a few sprints. Velocity goes from an internal planning tool to how a team’s performance is judged. This plays out in a few consistent ways:
- Inflated estimates. Story points creep upward because the target is the number, not the outcome. (Goodhart’s Law: when a measure becomes a target, it stops being a good measure.)
- Individual wins hiding team losses. One team looks “fast” while the end-to-end flow slows across dependencies.
- De-prioritized critical work. Security, reliability, refactoring, and technical debt reduction get deprioritized because they don’t “pay” in points.
- Eroded trust. Leaders see green dashboards; customers feel no improvement. Both sides conclude the other isn’t delivering.
Too often, velocity becomes THE performance target instead of what it was designed to do.
The Boundary That Matters
Velocity still has a role. It's a solid internal planning tool for a stable team estimating within their own cadence.
What it is not: a benchmark across teams, a performance measure for individuals or groups, or a leadership proxy for whether change is on track. The moment velocity does any of those jobs, teams risk being knocked off course by focusing on numbers more than the outcomes.
Replace it with Something That Actually Predicts Value
The alternative isn't harder metrics or more dashboards. It's a smarter, layered measurement stack, built by leadership and teams together: the BVSSH Framework, developed by Jonathan Smart, which North Highland adopted as the industry standard.
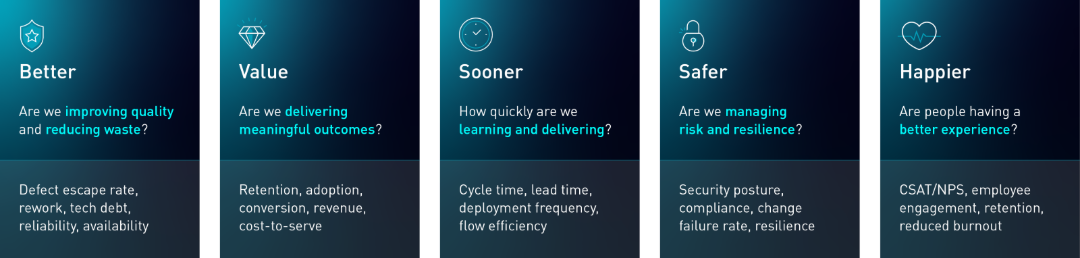
Google’s DevOps Research and Assessment (DORA) program has been studying what drives high- performing technology teams for over a decade, drawing on input from more than 39,000 professionals across industries worldwide.1 The takeaway is consistent: high- performing teams aren’t just faster, they deliver speed and stability at the same time. Velocity alone captures neither.
When organizations measure better, teams make better decisions and outcomes follow. You see the same pattern across contexts:
- Regulated platforms: Leaders push velocity → risk work becomes “invisible” → release risk rises. DORA found that internal developer platform adoption improved productivity but was associated with an 8% decrease in throughput, reinforcing that speed and productivity metrics alone can hide delivery risk. When teams balance velocity with measures such as change failure rate, recovery time, and deployment rework, behavior shifts toward safer delivery and less firefighting.
- Digital products: Velocity rises → conversion doesn't → output looks good while value stays flat. DORA found that user-centered teams achieve roughly 40% higher organizational performance, showing that measuring customer outcomes and feedback loops produces better results than optimizing for delivery activity alone. When measurement shifts to funnel outcomes and leading indicators, priorities change and effort moves toward learning and impact.
- Public sector service delivery: Throughput looks healthy → satisfaction stays flat → the bottleneck is masked. DORA found that unstable priorities significantly reduce productivity and increase burnout, suggesting that delivery pressure alone often obscures the real constraint. Introducing leading indicators that surface bottlenecks and priority conflicts earlier enables intervention before service outcomes deteriorate, improving results without simply demanding more throughput.
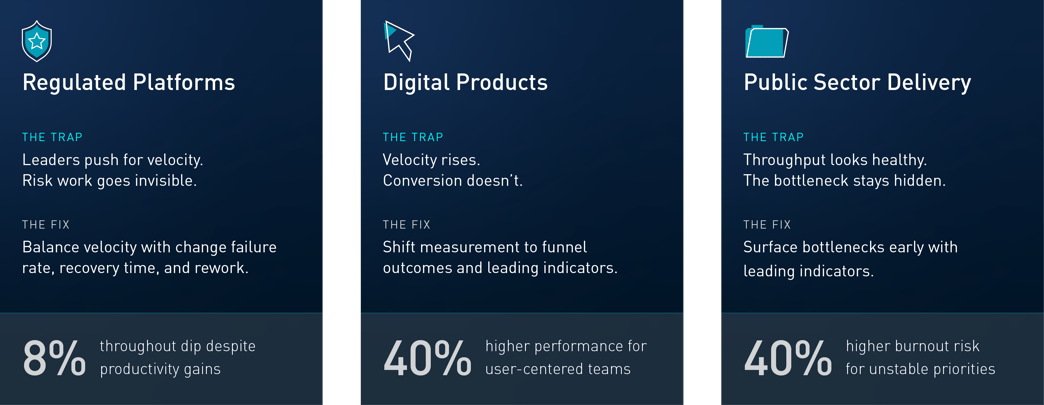
Across all cases, the point is the same: better metrics change decisions before outcomes move. That’s what leading indicators do.
The Harder Part: Changing What Leaders Do with Measurement
Here’s where most change efforts stall: leaders publish a new dashboard and call it done. But measurement doesn’t change because you changed the slide. It changes when leaders and teams change what they talk about, reward, and act on, week after week.
- Decide what success means now. Velocity stays a team planning tool. Leadership success becomes outcome movement, confidence level, and risk posture, and leaders repeat that definition until it sticks.
- Remove velocity from governance. Pull it out of status reporting, target-setting, and portfolio reviews. Offer cycle time and defect rates as alternative metrics, giving leadership, governance teams, or your PMO more insightful data.
- Build lightweight evidence rituals. Short, recurring feedback loops in premortems and postmortems that surface the reality of progress early and create safe escalation when outcomes stall.
- Equip teams to tell the evidence story. Simple templates and coaching help teams define outcomes, choose leading indicators, and communicate progress without anxiety or hand-waving.
- Incorporate continuous improvement: Set aside time on a regular basis for continuous improvement discussions and implementation. Metrics point teams to where they can create more value.
The Bottom Line
Velocity told you how fast the engine was running. It didn't tell you whether you were heading somewhere worth going.
The organizations getting this right aren't moving away from measurement. They’re moving toward measurement that matters. outcome-first, confidence-visible, risk-aware, and built in collaboration with the people who have to live by it.
If your current metrics are generating energy but not outcomes, the problem isn't the team. It's the signal you've asked them to optimize. North Highland helps organizations replace comfort metrics with a measurement stack that leadership and teams both trust. Let's talk about what that looks like for your portfolio.